Is there a technical reason to sell?
Goldman's Phillip Moffitt, head of Asian Pacific fixed income, said that the AUDUSD was a sell. He outlines his fundamental reasons for the price decline including:
- The RBA won't be as hawkish as "the market" expects
- They like the US dollar and expect higher US yields
- They expect the Fed to hike rates at a faster pace vs. "the markets" expectations
- If the AUDUSD rises, it might be a reason for the RBA to cut rates.
When "the market" thinks the RBA will be hawkish and the Fed less hawkish, and "the market" is wrong, that is a big opportunity for traders.
Mr. Moffitt/Goldman are thinking "the market" is wrong and they will be right.
Now they may indeed be right and the AUDUSD could go tumbling lower. They may also help contribute to that fall. After all, they are Goldman Sachs and they have bigger sacks of money to throw at the trade vs you or I. They may tilt "the market" or at least encourage their customers in that direction as well
Conversely, history is filled with what people think. There is also a history of the people like Mr. Moffitt who have been wrong about what they thought.
For me (and probably many of you too), what we think does not really matter. We cannot move the market one pip. I don't have direct control of money to help things happen. As a result, my proxy is always the price action and tools (technical tools) applied to it.
If Mr. Moffitt and Goldman is right, the technicals will show that the RBA will be more dovish and the Fed more hawkish. The price action will show that. It really will.
So what do the technicals say?
Are they showing signs of bearishness?
If not when will the bias be more bearish?
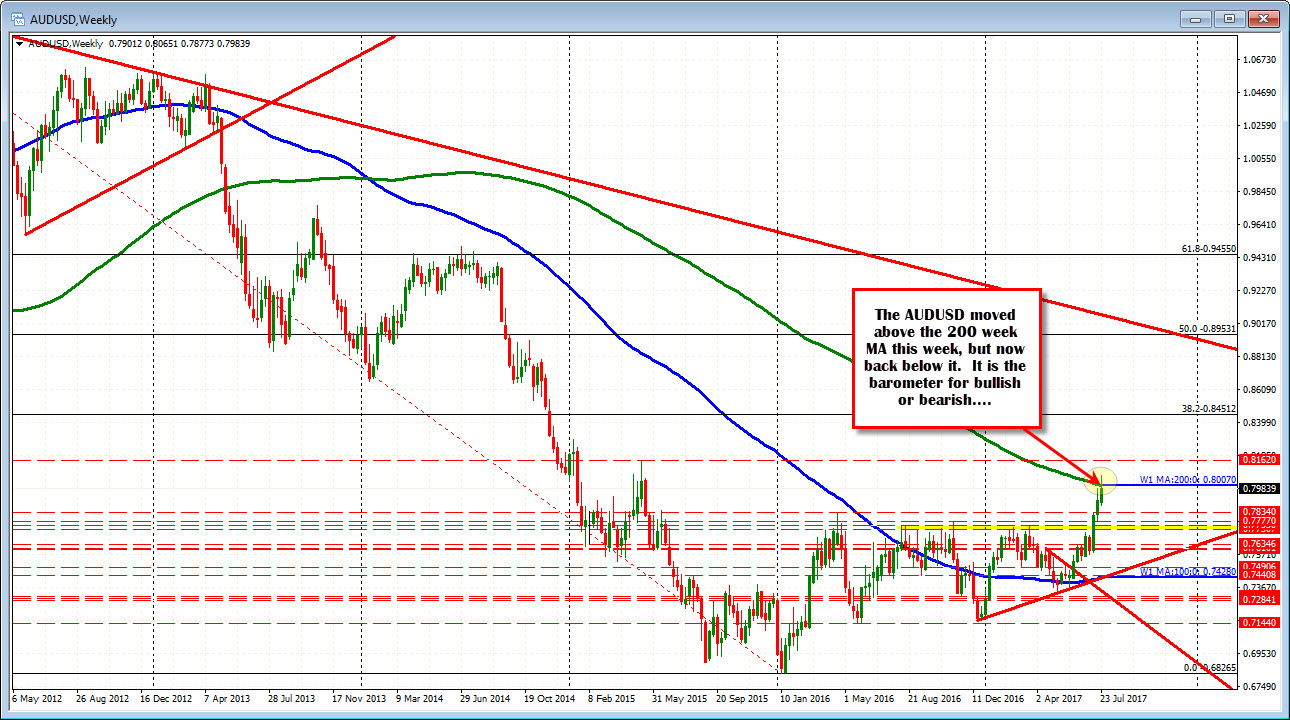
Looking at the weekly chart above. The 200 week MA comes in at 0.8007 this week (will be lower in the new week - expect 0.8000 next week). This week the price moved above the 200 week MA at the highs, but yesterday the price moved back below that MA line (more bearish).
Today, the high for the day has come in at 0.80069. Yes it stalled a fraction of a pip away from the 200 week MA. We are currently trading at 0.7980 area.
In my simplified world of trading, stay below the 200 week MA is more bearish. Move above is more bullish. That is the barometer for the bias of "the market".
Does that mean, if the price goes above and then moves back below the MA line, I would not re-sell?
No.
One advantage of retail traders is we can get out and get back in. That is something the big boys don't necessarily have in their trading. So being a retail trader is not all bad. Keep that in mind. The 200 week MA is and will be important going forward.
Just looking that view, the price is below the MA, the bias is indeed bearish. Stay below 0.8007 and the price should go lower.
Drilling down to the hourly chart (see chart below), it shows more of a battle.
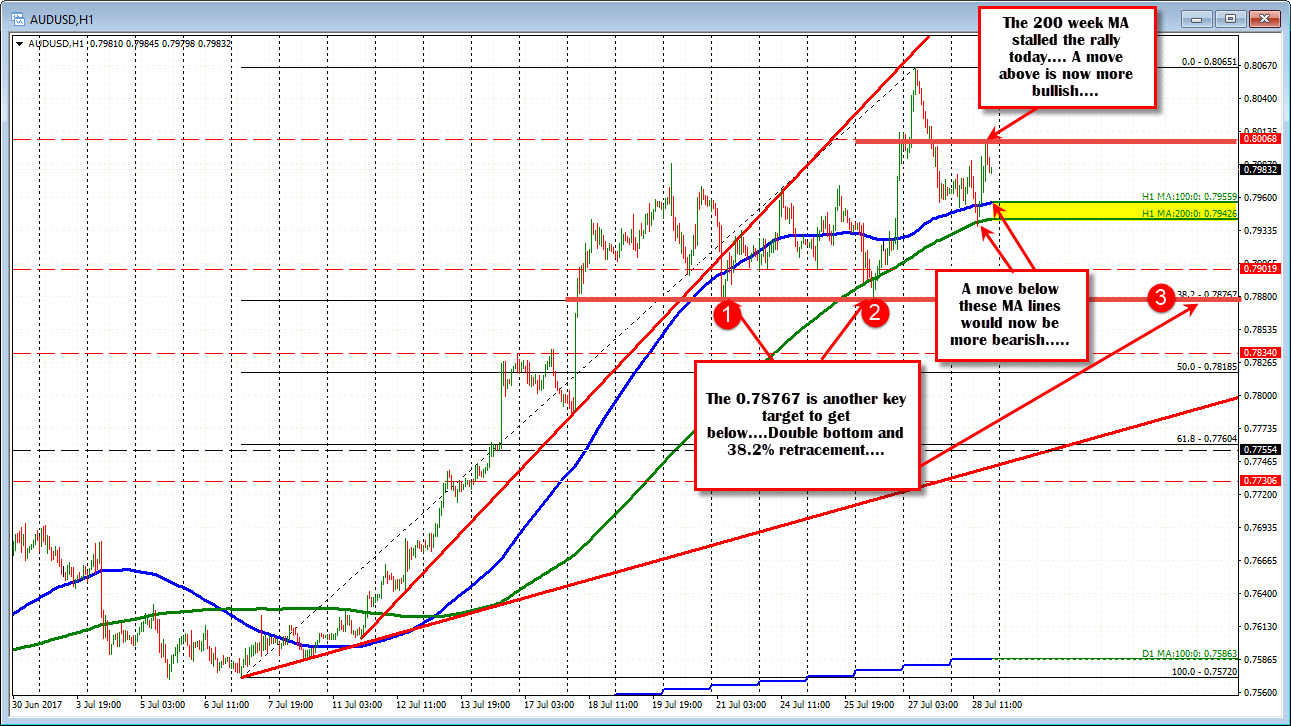
Again, in my simplified world (which is not a bad thing by the way), we know the 0.8007 level is the 200 week MA. The chart shows how the price reacted to that level - sellers stopped it on two hourly bars. That is bearish.
On the downside (i.e. at the lows today), the 200 hour MA (green line) stalled the fall. In a post yesterday, I outlined these levels (see post here).
At the time, I wrote the following. It is important because the trading action is still the same:
"What now?
The 100 hour MA comes in at 0.7947 0.79559 (currently - blue line). The 200 hour MA comes in at 0.7928.0.7947 (currently - green line). Those two moving averages are now downside targets. Get below and there could be further downside potential with the double bottom at 0.7874 the next key target."
I added:
"The 200 week MA will now become resistance again should there be a rebound from the current levels. Stay below, and the corrective move can continue. Move above, and all bearish thoughts are gone".
I concluded:
"Whether this move lower turns into something more bearish, is now dependent on what happens at the 100 and 200 hour MAs (blue and green lines). Holding will give the bulls new life. A move below, and buyers should give up for now and we head to 0.7874 and see what happens then."
SUMMARY
I don't really know if Mr. Moffitt's view (and fundamental story) will play out. However, a bearish view is being supported by the weekly chart as long as the price stays below that MA level at 0.8007.
Staying below tells me "the market is more bearish".
If the price goes above, it may only be temporary, but it does turn the bullish/bearish barometer to more bullish. Get out and wait for a re-break for another bearish opportunity (it happens).
On the downside, clues will come from the hourly chart.
More specifically, on a move back below the 100 and 200 hour MAs at 0.79559 and 0.79426 respectively, the bias turns more bearish.
Below that level the 0.7876 is another key level to get below (double bottom and retracement level on the hourly chart).
From, there traders can manage the risk to other targets, or look for failures of the breaks (i.e. if it goes back above the 100 hour MA, get out).
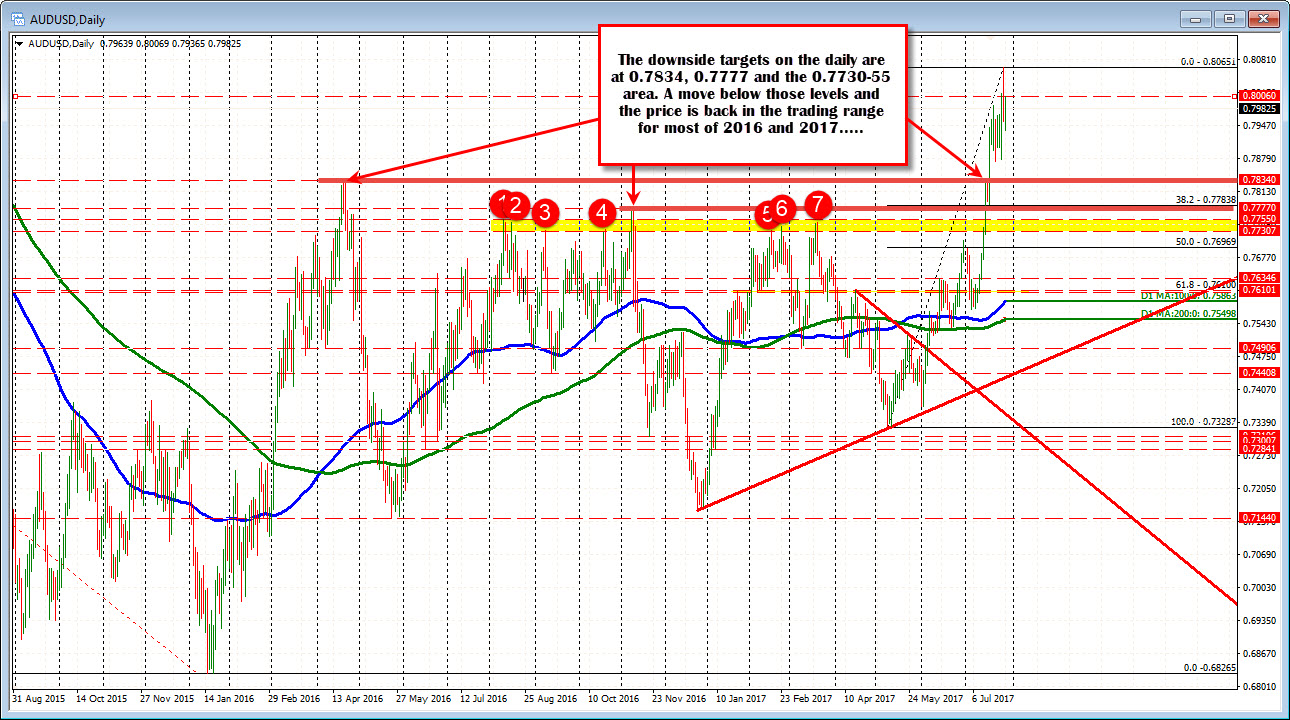
Looking at prior swing lows on the daily chart, the high from April 2016 comes in at 0.7834. That is a target. The high from November 2016 comes in at 0.7777. That is another target. Below that there are a number of swing levels at 0.7730-55 (see chart below). Get below that area (yellow area in the chart below) and the price re-enters the range that has confined the range going back to 2016.
What do you think of the trade? Are you bearish? If so, this is the time to get involved.