
The latest cryptocurrency to race higher
The price of Ripple has been the latest cryptocurrency to catch the wave higher. Adam talks about it in an earlier post.
For me, in these "currencies" if you are going to play, it helps to know about where to get in. If the overall bias is to the upside in these cryptocurrencies (the vast majority of the players are either long or square), if you can get in (long) at a low risk level - and the risk focused "market" does too - the price will go higher. If the price does not hold the risk defining level (i.e., it breaks lower) you can just get out and look for the next opportunity (i.e. when it moves back above the risk defining level).
So where are the low risk levels?
For me, I look toward the 100 and 200 hour MAs for clues in the digital currencies.
If I can look at a chart (any chart), and I see those MAs holding support (or resistance), it gives me confidence that I am not the only trader out there in the world looking to define and limit risk against those risk defining levels. Putting it another way, I am not the only trader who is looking for cheap levels to buy.

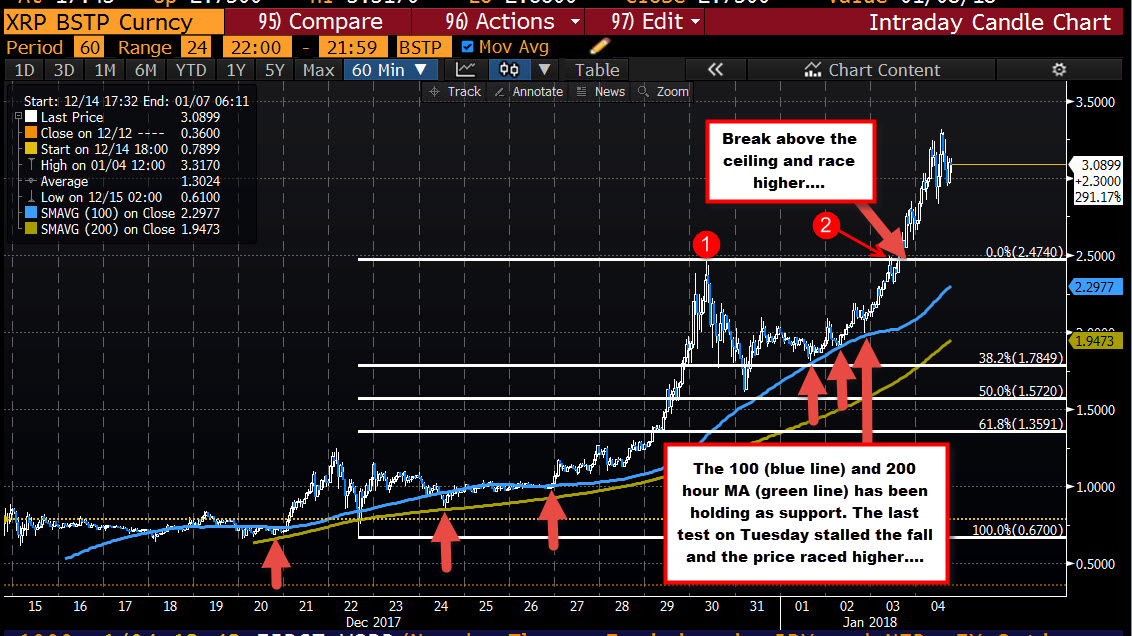
Above is the hourly chart of Ripple on Bitstamp. The blue line represents the 100 hour MA. The green line is the 200 hour MA.
What is noticeable around those lines (see large red arrows)?
The "market" has been using those levels as risk defining levels. That is, when tested, traders come in against the level and buy. Just look at the large red arrows for the proof.
That tells me risk can be defined and limited at those levels. It also tells me, that if I want to buy, that area (around the MAs) is where I want to venture in the water. IF the price bounces, I can manage the winner. If the price does not bounce, I can get out with a small loss.
That is the basis for all risk focused traders no matter what they may be trading. Even in infant markets like Ripple, traders will tend to do the same thing that they will tend to do in the EURUSD or the USDJPY, or Apple, or Gold. If they are buying, they buy against a risk defining level like the 100 and 200 hour MA, and if broken, they will get out.
So looking at the chart above, the price based against the 100 hour MA last on Monday and Tuesday (there are no days off in trading). Yesterday, the price took off and the current price at $3.0899 is not really close to the 100 hour MA at $2.2977 (and moving higher). So it is not a time to buy as the risk is $0.80 which is 26% (at $3.08).
What do you do if you want to get in but don't want to risk 26%?
You can drill down to a shorter chart to see if there is any technical clues that the "market" may be focusing on.
Looking at the 5 minute chart below, the same 100 and 200 bar MA are on that chart (blue and green lines).
I have also added a trend line connecting recent lows.
What I notice is on the run higher, there have been instances where buyers came in against the MA lines. However, the risk defining level that traders are really paying attention to is the trend line.
There are 6 points on that line. So stay above is more bullish. Move below and bias turns more bearish. On a break, the bias turns more corrective, the buying should dry up. The price should go lower. We don't know, but the price may head down toward the rising 100 hour MA on a break in which case it would be a lower level to try to buy again.
What happens if the trend line is not broken?
You are a winner and you look for the high at $3.317 to be broken and the price momentum higher to continue.

SUMMARY:
Trader in any instrument will often look for levels to buy (or sell). The best levels are where the risk can defined and limited. It does not matter if it is Bitcoin, or EURUSD, or Gold or Crude oil, traders look to limit risk on buys and sells.
Ripple shows those tendencies too.
So follow some key tools. Be patient. Know your risk and if you can catch a wave, like the Beach Boys sang, you might be sitting on top of the world (or at least a cryptocurrency world).

