
FX trading news for July 19, 2017.
- Healthcare hope keeps stocks bid. Record closes.
- Bin Salman's rise to Crown Prince was a coup
- US Senator Hatch: First senate procedural vote on repealing Obamacare could be Monday
- US, Mexico and Canada agree on getting NAFTA talks going
- US crude oil futures settle at $47.12 /bbl.
- CIBC: The times are changing for the ECB
- Trump: We have no choice. Have to repeal and replace Obamacare
- Larger draw down in crude (again), but 38.2% retracement stalls rally
- European stocks end the day mostly higher
- Morgan Stanley picks Frankfurt as their new trading hub
- DOE Crude oil inventories for the July 15th week -4727K vs -3500K est.
- The Atlanta Fed GDPNow estimate comes in at 2.5%
- US building permits for June 1254K vs. 1201K estimate
- Canada May manufacturing sales +1.1% vs +0.8% expected
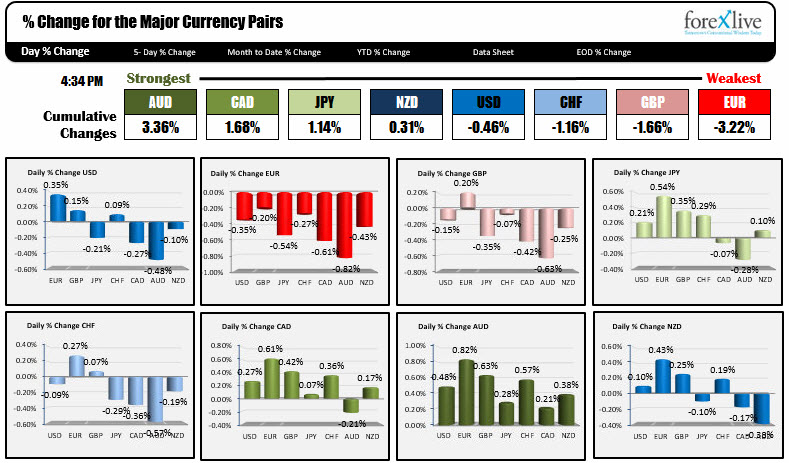
- The strongest and weakest currencies as NA traders enter for the day
In other markets:
- Spot gold ends the day down -$2.85 to 1241.21
- Crude oil $47.09 up $0.69 or 1.49%
- US yields were marginally higher. 2 year 1.356%, up 1 bp. 5 year 1.824%, up 1 bp. 10 year 2.269%, up 1 bp. 30 year 2.851%, up 0.5 bp
- US stock indices record closes across the board. S&P up 0.54%. Nasdaq up 0.64%. Dow up 0.31%
The story is getting to be a bit redundant. There was not much in the way of data in the US. The one piece of economic data that was released - US housing starts and building permits - came in higher than expected. Nevertheless, the USD still moved down a bit with some gains against some currencies (EUR, GBP and CHF) and declines against others (JPY, CAD, AUD and NZD).
What is also redundant in the story?
A lower dollar is good for stocks (or at least it helps contribute to the story). We are in the midst of earnings and so far, they seem to be doing well. The lower dollar should certainly help the multinationals and the stock market seems to like that story.
Another theme is Teflon Don's recoveries (which stocks love too). Let's review. The House took two shots to pass a healthcare bill. It went to the Senate and tries one and two failed. So President Trump invites Senators for lunch, turns the screws, puts more pressure on his own Republican party to find a solution (the Democrats must have really quiet days) and lo and behold higher and higher stocks go.
Now, the story over the nest 24 hours will shift to a new focus as the BOJ and ECB have meetings and talk about policy, Australia released employment numbers and in the UK retail sales figures will be released. The redundant story will shift the focus to something new.
Below is a technical review of some of the major currency pairs as we head into the new trading day (and a new story line).
The BOJ is expected to stay the course when they announce later today. Technically, the USDJPY sits right on a cluster of key technical levels including the 100 and 200 day MA and 50% retracement. That area is between 111.637 and 111.888. The price trades at 111.84 currently. One thing to be aware is the CFTCs speculative short JPY position is at high levels (short -112 contract). When positions are at extremes, it could lead to a squeeze if pushed. The risk from a squeeze is therefore to the downside in the USDJPY (JPY goes higher). For a discussion on this idea, click here.
The EURUSD corrected off the highest level since May 2016 today. The range was limited to about 45 pips but the high was in the 1st hour and the pair went out within 5 pips of the low for the day. So the wander was lower. The low fro the day reached 1.1509. The 38.2% of the move up from the last week's low comes in at 1.15013. The 100 hour MA is at 1.1487. The price moved above that MA line on Friday after lower than expected CPI and retail sales in the US and has not traded below it since. On a dip look for buyers against the MA line as a trade before the ECB. The ECB is tomorrow at 7:45 AM ET/1145 GMT with the presser at 8:30 AM ET/1230 GMT, and the debate is will Draghi finesse more talk of a tapering of QE or will he pass for another day. After that, what is the implication on the EURUSD from his words? Pointing the upside, is the EURUSD moved above key resistance at 114.35-65 this week, and what we know from the commitment of traders report in this currency, is that the longs are at the highest level since May 2011. For this pair, the speculators are right (the JPY traders are sucking a bit of wind on their shorts). Do they know something? Are European businesses hedging exposure for a further run higher in the EURUSD? Is it simply inevitable as the ECB starts to do what the FOMC has been doing (it cannot go on forever)? Watch 1.1435-65 for support on any dip in the new day. Putting it another way, risk for longs is that area. Dips should be bought until that is broken.
The Australian employment will be released at 9:30 PM ET/0130 GMT. Eamonn has a great preview here. The AUDUSD is going into the report trading at the highest level since May 2015. Last week and this week, the price moved above resistance at 0.7731-55 and then the 2016 high at 0.7834. We currently trade at 0.7955. The break higher has the pair targeting the 200 week MA at 0.8013 area. That MA should give the buyers cause for pause on the first test but if broken, there isn't a whole lot of resistance. So don't be a "pick the top hero" (a better trade above the 200 hour MA would be to go long and reverse if the break fails). On the downside, it took over a year to break the aforementioned technical levels (i.e. 2016 high at 0.7834). The 100 hour MA is at 0.7855, about 20 pips above the 2016 high. IF there is a dip on the data, watch that MA for support buyers. If it holds, the AUDUSD longs are liking it and they remain in control A move below and the 0.7834 will be tested with stops on a break lower.

