
200 hour MA stalled the fall yesterday.
In the bitcoin technical report yesterday, the price fall fell below the 200 hour moving average, but quickly recovered back above the level. In the post yesterday, I wrote:

Today, although the price moved below that 200 hour MA line (more bearish) we are currently trading back above that key MA line. As a result, for traders we are at another technical crossroad for the pair.
- Stay above the 200 hour MA and we should see short covering/new buying return.
- If we break below,however, expect a further corrective move lower. The tops at $4921 and $4926 would be the next targets on a break lower (see hourly chart above and blue circles).
What happened?
The price stayed above the MA line and the buyers returned. This is what the chart looks like now.
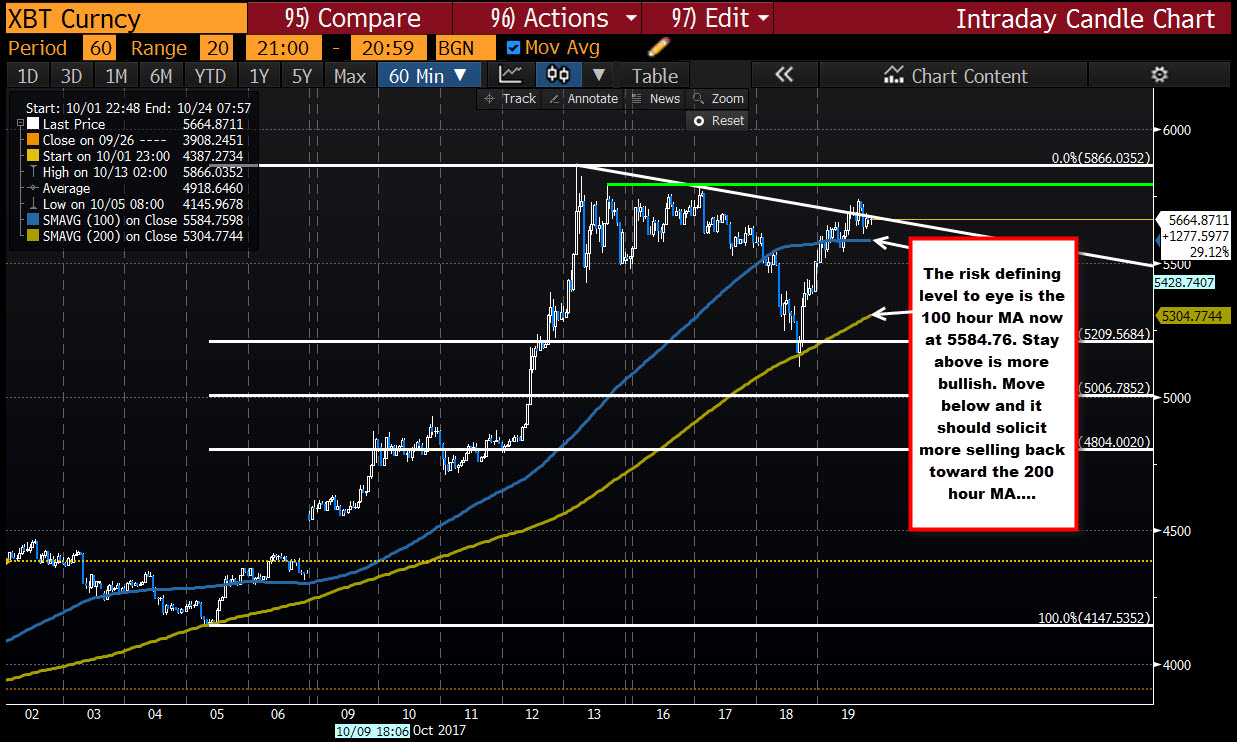
The move higher - yesterday and today - has seen the price move back above its 100 hour MA (blue line).
- Stay above that MA line at 5584.76 and the buyers remain in control. The all time highs will be tested.
- Move below and the rally higher is running out of steam and we could see a move back toward the 200 hour MA at 5304.77 (and rising).
As mentioned in previous posts, trading the crytocurrency requires paying attention to the technicals. The volatility is just too great. So the smart traders out there in cryptotrading, will tend to define and limit risk against key technical levels. To ignore the clues opens yourself up to potentially big swings. Yesterday, the price fell 9% before starting the rebound back higher. Being on the wrong side can be detrimental to your trading account - especially if the bias swings dramatically.
So be careful. Be disciplined and listen to what "the market" is saying.

