Breaks above 200 hour MA and shorts gave up
Adam posted on the quick run up in the price of crude oil The price shot up from about $61.10 to a high or $62.43. The move seemed to come out of nowhere.
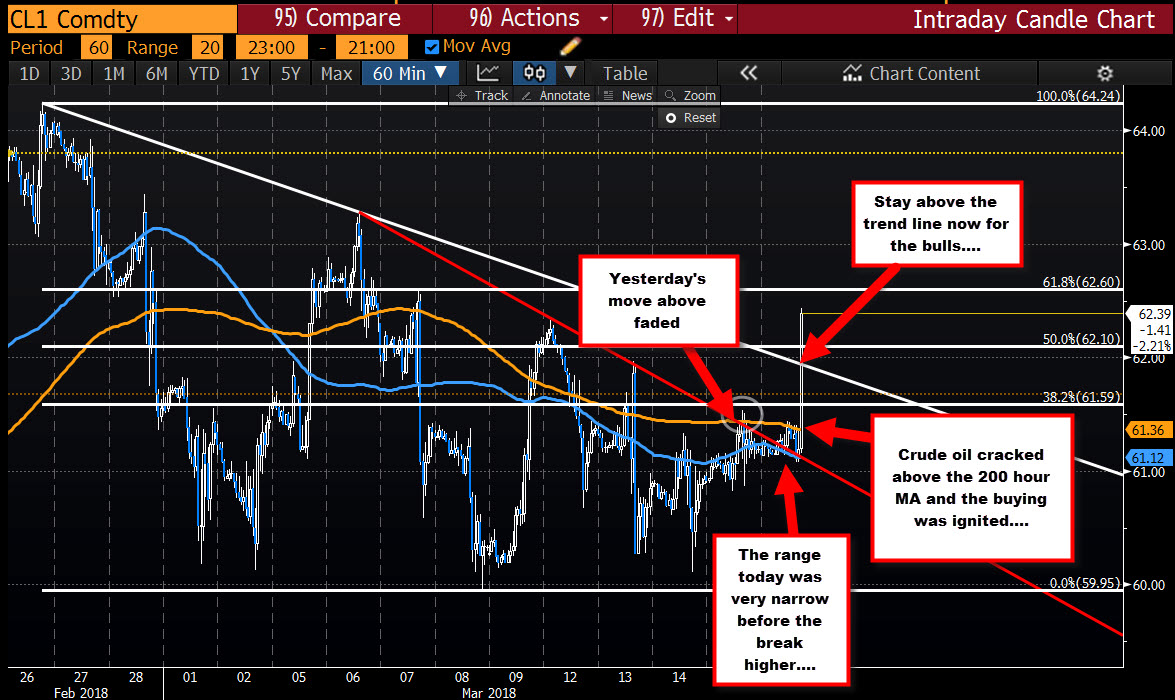
However, if you look at the hourly chart, I blame the technicals for the move.
Looking at that chart above, the price over the last few days has used that MA line (green line) as a level to sell against.
There was a quick move above yesterday, but that was quickly reversed.
Today, the range was in a very narrow trading range between $61.44 and $61.08 ($0.36). The 200 hour MA was keeping a lid on the pair.
When you have a narrow trading range, and a technical level is broken, there is that potential for the fuse to be lit and the market to explode in the direction of the break.
Guess what?
The fuse was lit, the market exploded. I blame the technicals for the move.
The next target above comes in at $62.60 (the 61.8% retracement). ON the downside, look for the broken trend line/50% retracement to be a risk level for the buyers now.
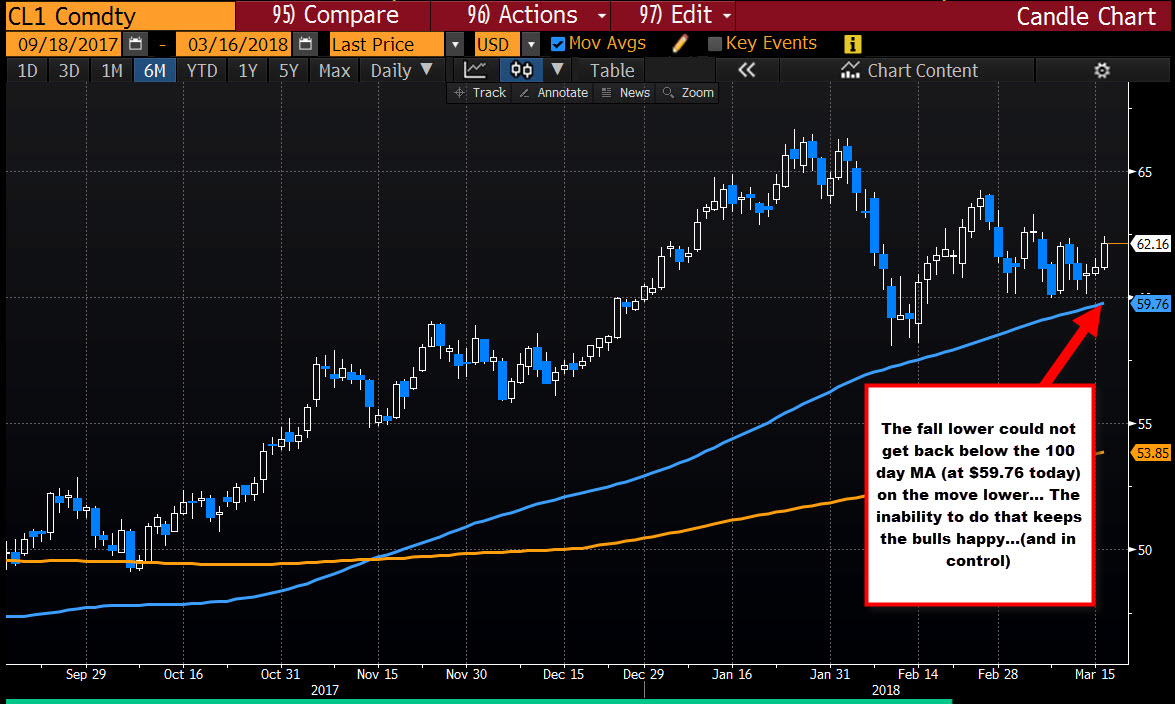
Taking a broader view from the daily chart below, the fall lower this month kept on finding support above the $60 level. The 100 day MA moved higher and closer to the price, but could not seriously test the MA line (blue line in the chart below) at $59.76 (today). That inability kept the buyers satisfied and is also a catalyst for the upside today.