
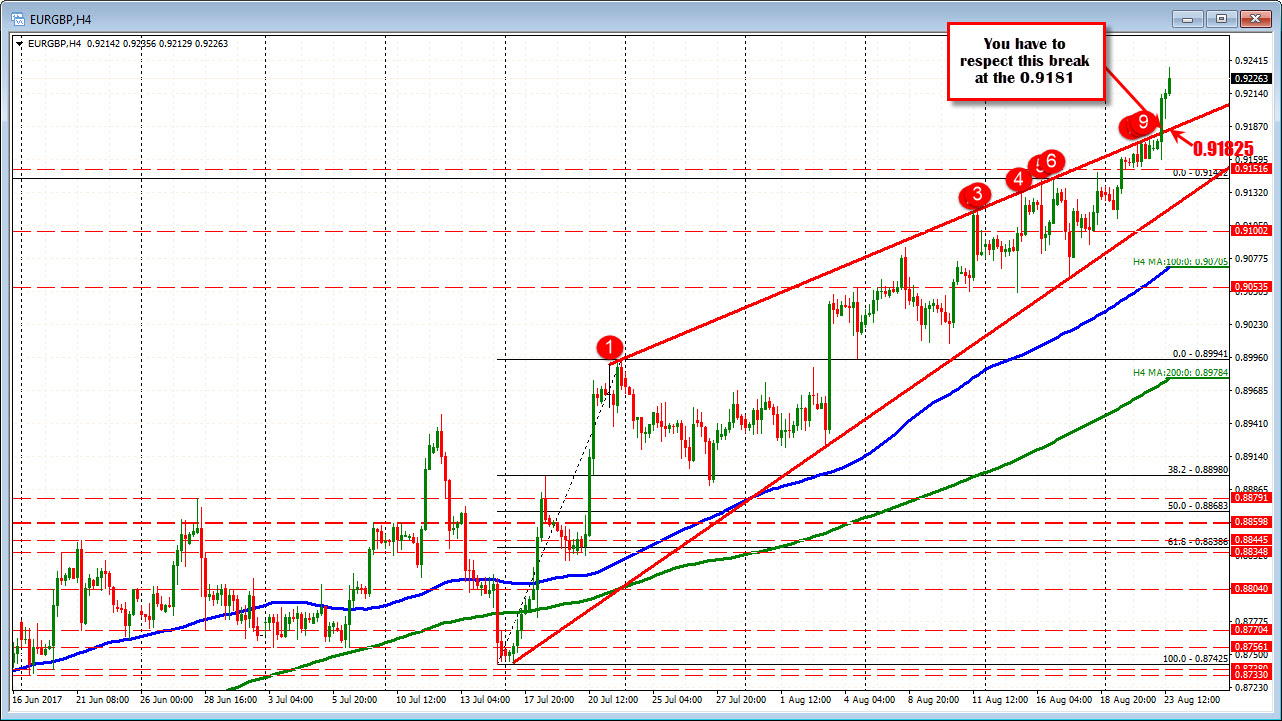
Extends above topside trend line on the 4-hour chart today
Yesterday, I posted about the EURBGP. At the time the pair was holding against topside trend line resistance (see post here). That trend line held at 0.9177 and the price did rotate modestly to 0.91599. I said the correction was modest.
The price decline stalled. The trend line was broken on the 4-hour chart at 0.9181 today, and the pair moved higher. The high today has reached 0.9235.
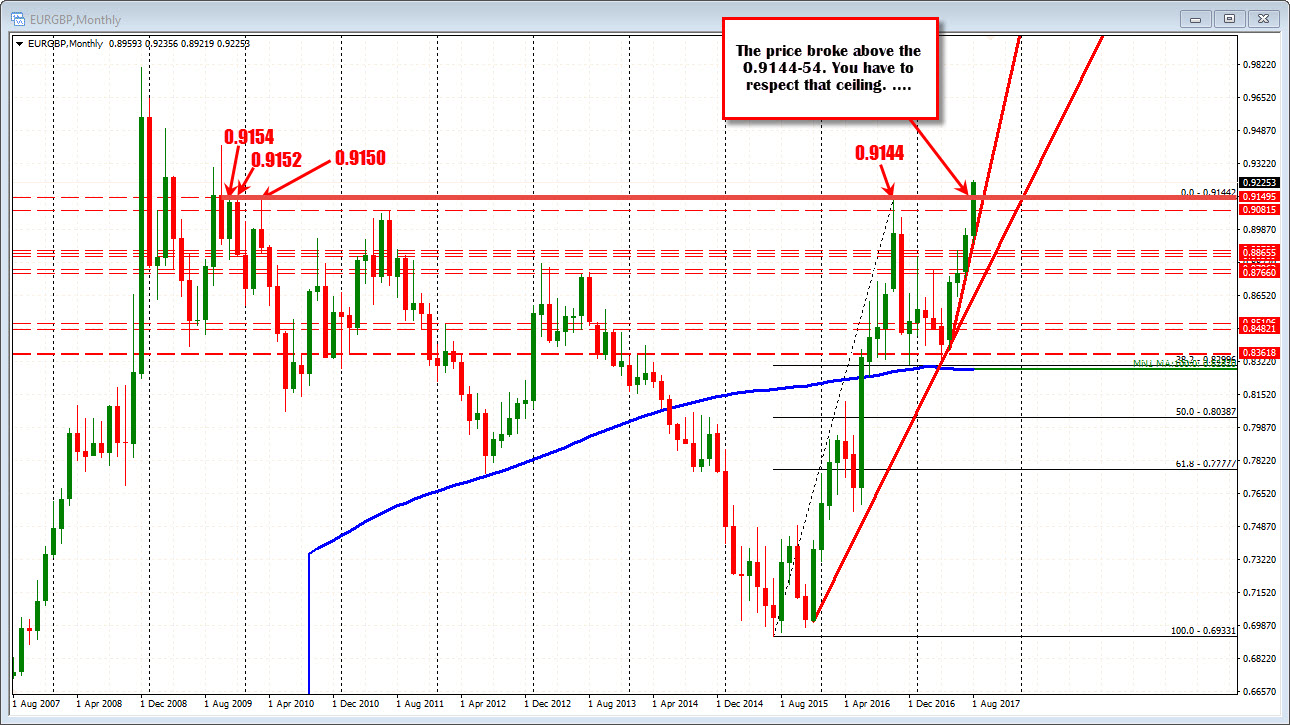
Putting things into perspective from the longer term, the price is trading at the highest level since October 2009. That is nearly 8 years ago. Prior swing highs on the monthly chart below came in at 0.9154 (Nov 2009), 0.9152 (Dec 2009), 0.9150 (March 2010), and most recently at 0.9144 (2016 high price). That area was busted on Monday. Yesterday the low stalled at 0.9153. That is a pretty good hold technically. The buyers leaned against the 0.9144-54 and today we got the break above the 4-hour chart trend line.
What next?
- You have to respect the trend line on the 4-hour at 0.91825 (and moving higher at about 1-2 pips per 4-hour bar). That is a risk level for longs
- You have to respect the 0.9144-54 area too. That was home to 4 swing highs going back to 2009.
Stay above those levels keeps the buyers in control. The price is breaking.
Any closer clues?
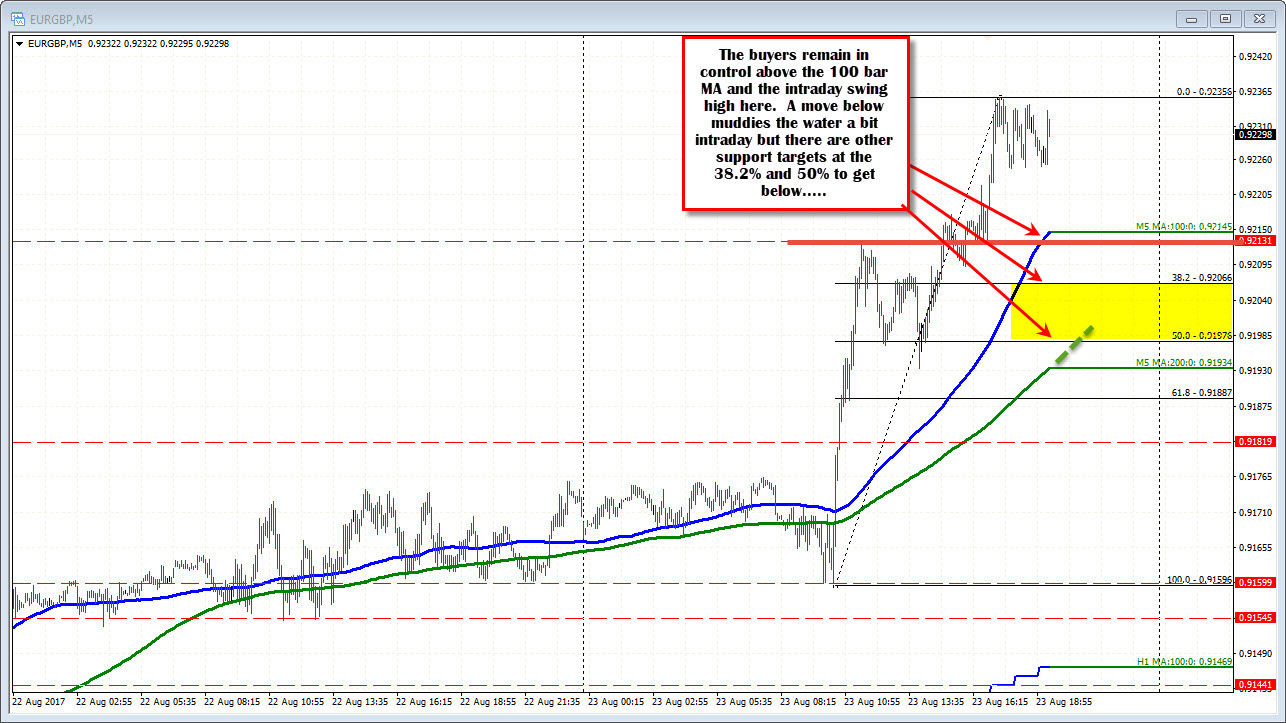
Drilling to the 5-minute chart below, the low today stalled at 0.91596 - 5 pips above the 0.9154 level. The price trended hgiher.
The intraday peak stalled at 0.9213. The 100 bar MA on the 5 minute chart comes in at 0.92141 now (blue line) that is a closer support area. Stay above and the intraday buyers are comfortable.
Below that, the 38.2% of the range today is at 0.92066. The 50% is 0.92976. The 200 bar MA is moving higher at 0.9193. Those are closer risk levels for longs.
SUMMARY:
The EURGBP has had some pretty significant breaks on the monthly chart and the 4-hour chart. You cannot ignore those breaks. If the price is to turn the beat around, moving below those levels are needed going forward.
There is closer risk for longs, but only from the intraday chart. The pair has been trending today. So a break of the 100 bar MA on the 5 minute chart or going below retracement levels would make the intraday picture more corrective.
Overall, however, the buyers remain in control all the way around for now. R-E-S-P-E-C-T the trend and the breaks.

