Prior month 0.17 revised higher to 0.36
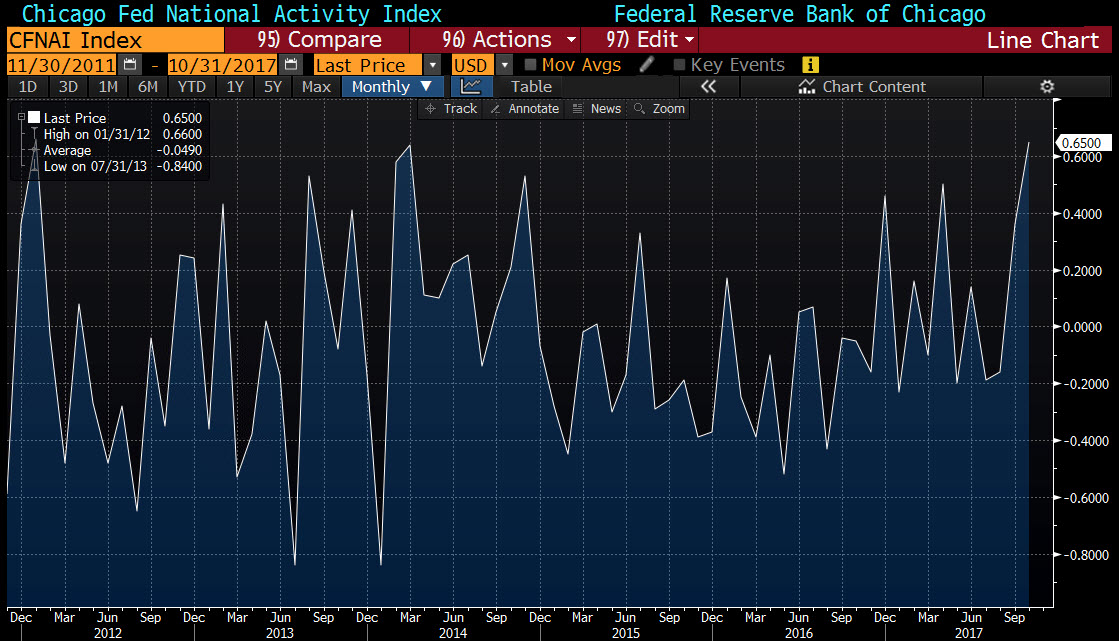
The Chicago Fed national activity index for October came in much better at 0.65 versus 0.2 estimate. The prior month was also revised higher from 0.17 to 0.36.
- This was the highest level since January 2012
- 56 of 85 monthly individual indicators make positive contributions, while 29 indicators were lower
- The 85 economic indicators that are included in the CFNAI are drawn from four broad categories of data: production and income; employment, unemployment, and hours; personal consumption and housing; and sales, orders, and inventories
- The contribution from production-related indicators to the CFNAI rose to +0.53 in October from +0.18 in September
- Employment-related indicators contributed +0.11 to the CFNAI in October, down slightly from +0.13 in September
- The contribution of the personal consumption and housing category to the CFNAI edged down to -0.04 in October from -0.02 in September
- The sales, orders, and inventories category also made a positive contribution to the CFNAI in October, though the contribution edged down to +0.05 from +0.08 in September.
- The CFNAI Diffusion Index, which is also a three-month moving average, moved up to +0.19 in October from -0.05 in September
- A reading below zero indicates below trend growth in national economy
A soft survey report, but impressive gains and revisions.