Been moving up and down of late
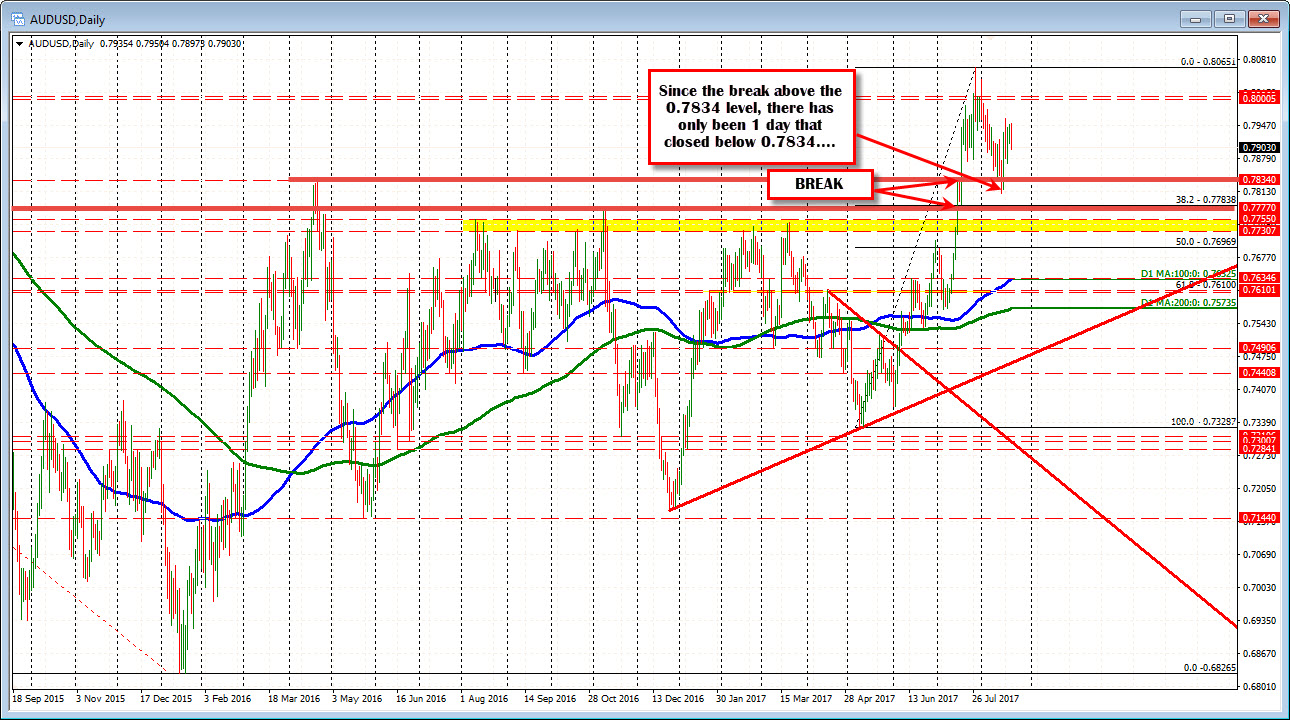
The AUDUSD moved above 2016 highs in July. The swing highs were in the 0.7730-55 area. Then 0.7834. Since that time, the price has one day with a close below the 0.7834. The current price is just above 0.7900 (at 0.7903). Bullish for the AUDUSD above 0.7834.
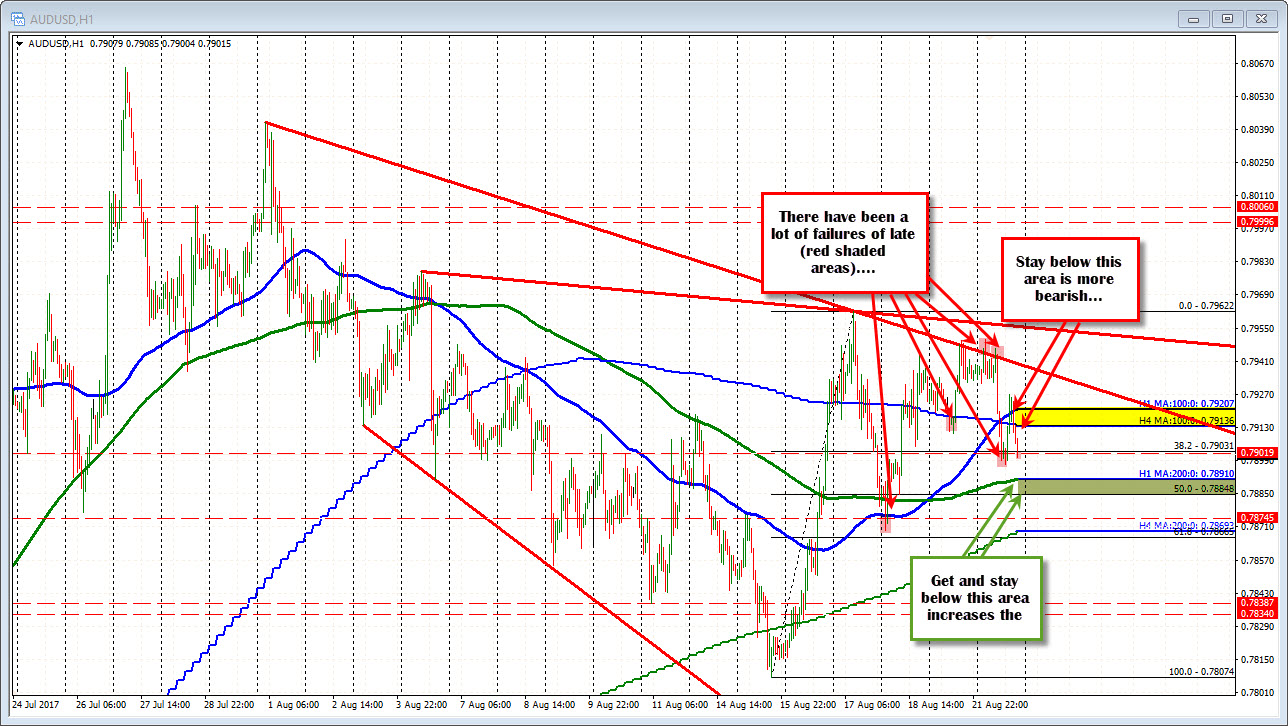
Drilling to the hourly chart, the price has been moving up and down over the last 4 trading days. The high price on Thursday last week stalled at 0.7962. The low on Friday reached 0.7883. That dip fell below the 200 and 100 hour MAs (green and blue lines in the chart below) but that break was quickly reversed.
The move back higher but stalled near a topside trend line/ The low today reached just below the 0.7900 to 0.7897.
Honestly, the technical picture on the hourly is a bit messy. Today in the London session the 38.2% retracement was broken at 0.7903 but stalled. IN the NY session the 100 hour MA was broken at 0.79207 but that rally stalled too (high reached 0.7927). So there are failures on breaks all over the place.
Nevertheless, if I were to give a bias from the price action, I would favor the short side.
- The new high for the week today failed.
- The price fell below the topside trend line on the hourly
- The price fell and is now below the 100 hour MA, the 100 bar MA on the 4hour chart
The price has to get and stay below the 0.7900 level and then the 200 hour MA at 0.7891.
The 50% of the move up from the August 14 low comes in at 0.78848.
Stay below those levels and the sellers are making more progress. However, given the failures of late, be aware of failures and snap back moves. It is what we have been seeing of late and the pattern of uncertainty may continue.