
Trades between the 100 and 200 hour MA
Yesterday the USDJPY traded to the highest level since November 15th at 113.74 (see hourly chart below). The fall from the high
- Fell below a trend line at 113.43,
- continued to a swing level (see yellow area and red circles),
- bounced back to the underside of the broken trend line, and
- finally fell to the 200 hour MA (green line) at 112.952.
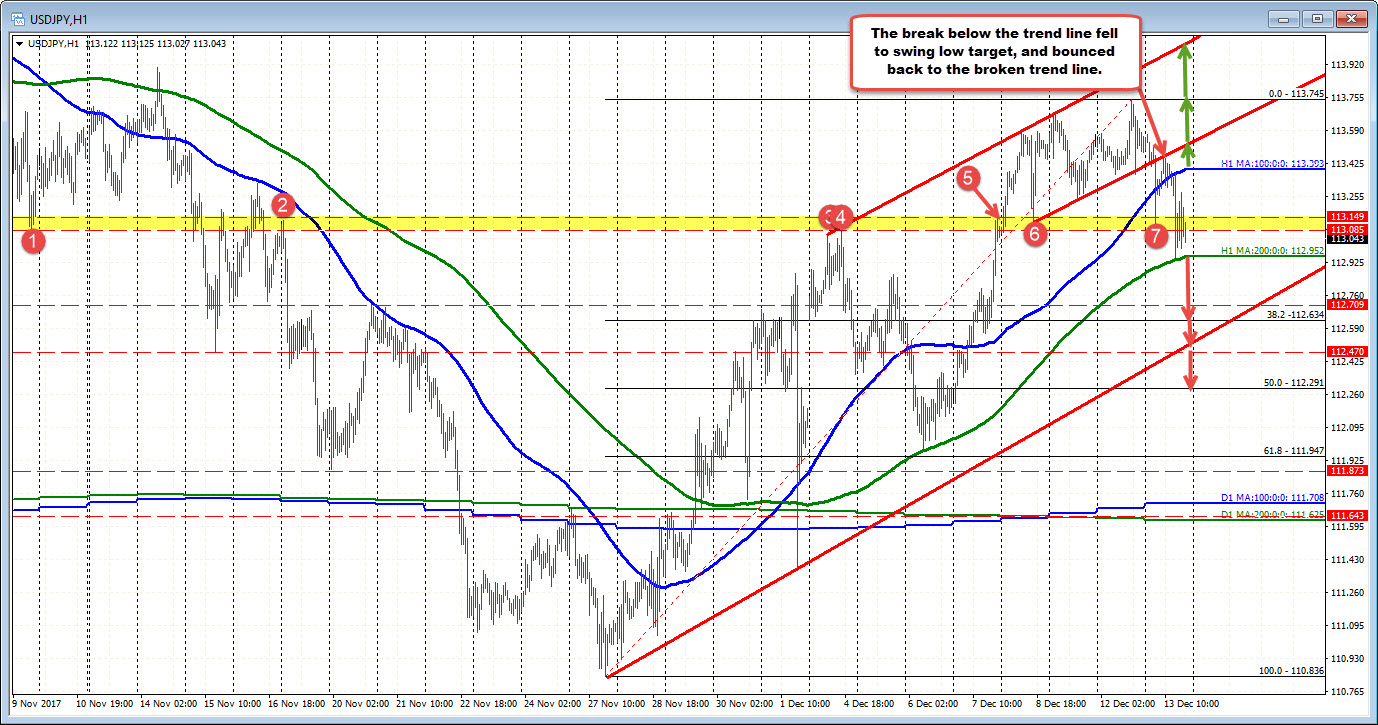
The importance of all that price action is that the market pretty much did it's A-B-C's . It failed, it broke, it tested, it re-tested the break, it stalled the fall at key MA support.
Now what?
We trade between the 100 and 200 hour MAs with the 100 hour MA above at 113.393 and the 200 hour MA at 112.95. The market trades at 113.07 (as I type) and awaits the FOMC decision. That makes sense too. Let the Fed bias, send the pair higher (on more hawkish) or lower on less hawkish (the projection is 100% the Fed will tighten).
On a more hawkish Fed, a move to and likely through the
- 100 hour MA at 113.393 will be eyed.
- The underside of the broken trend line at 113.51 and
- then the high from yesterday at 113.745.
- A move above that high will look toward the topside trend line at 114.00.
Those steps will be the next targets.
On a less hawkish Fed, the
- 200 hour MA will be easily broken at 112.95
- The 38.2% at 112.634 is next target followed by
- A lower trend line at 112.48,
- The 50% of the move up from November 27th comes in at 112.29
When trading events, there is the known (the Fed will tighen) and the unknowns (what will the dot plot and other data from the central tendencies show, what will Yellen say). The "unknowns" will be what the market trades off of. The price action and the tools (i.e. steps) define the steps that we can expect traders to react to. Get above or below levels, leads to the next target.
Have a plan. Trade the levels. Look for the next targets in the direction and keep focused on the headlines in case a surprise is dropped.

